Good evening,
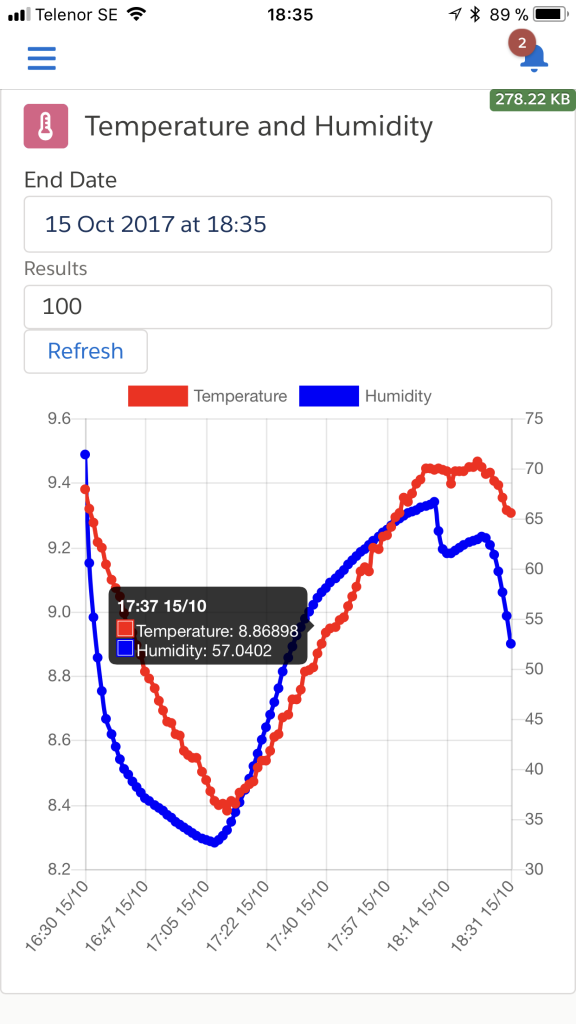
In my previous post (Upgrade your Electric Imp IoT Trailhead Project to use Big Objects ) I showed how you can use Big Objects to archive data and now I will show how you can visualise the data in a Lightning Component.
So now we have big objects being created but the only way to see them is by executing a SOQL query in the Developer Console (SELECT DeviceId__c, Temperature__c, Humidity__c, ts__c FROM Fridge_Reading_History__b).
I have created a Lightning Component that uses an Apex Class to retrieve the data.
Lets start with a screen shot on how it looks and then post the wall of code

And here’s the code: Lightning Component
<aura:component implements="force:appHostable,flexipage:availableForAllPageTypes" access="global" controller="FridgeReadingHistoryController" description="FridgeReadingHistoryComponent">
    <ltng:require scripts="{!$Resource.chartjs_270}"></ltng:require>
    <aura:attribute type="DateTime" name="today"></aura:attribute>
    <aura:attribute default="200" type="Integer" name="results"></aura:attribute>
    <aura:attribute type="Integer" name="width"></aura:attribute>
    <aura:attribute type="Integer" name="height"></aura:attribute>
    <aura:handler action="{!c.doinit}" name="init" value="{!this}"></aura:handler>
    <article class="slds-card">
        <div class="slds-card__header slds-grid">
            <header class="slds-media slds-media_center slds-has-flexi-truncate">
                <div class="slds-media__figure">
                <span class="slds-icon_container slds-icon-standard-contact" title="description of icon when needed">
                    <lightning:icon iconname="custom:custom97"></lightning:icon>
                </span>
                </div>
                <div class="slds-media__body">
                    <h2>
                        <a href="javascript:void(0);" class="slds-card__header-link slds-truncate" title="[object Object]">
                            <span class="slds-text-heading_small">Temperature and Humidity</span>
                        </a>
                    </h2>
                </div>
            </header>
            <div class="slds-no-flex">
            </div>
        </div>
        <div style="height: 100%" class="slds-card__body slds-card__body_inner">
            <ui:inputdatetime displaydatepicker="true" class="form-control" aura:id="endDate" value="{!v.today}" label="End Date"></ui:inputdatetime>
            <lightning:input type="number" name="results" value="{!v.results}" label="Results"></lightning:input>
            <button class="slds-button slds-button_neutral" onclick="{!c.refreshData}">Refresh</button>
            <canvas width="{!v.width}" class="chartjs-render-monitor" id="temperature" height="{!v.height-200}"></canvas>
        </div>
        <footer class="slds-card__footer"></footer>
    </article>
    <div class="slds-spinner_container slds-hide" aura:id="spinner">
        <div role="alert" class="slds-spinner--brand slds-spinner slds-spinner--medium" aria-hidden="false">
            <div class="slds-spinner__dot-a"></div>
            <div class="slds-spinner__dot-b"></div>
        </div>
    </div>
</aura:component>
/**
 * Created by Johan Karlsteen on 2017-10-08.
 */
({
    doinit : function(component,event,helper){
        var today = new Date();
        component.set("v.today", today.toISOString());
        console.log(document.documentElement);
        component.set("v.width", document.documentElement.clientWidth);
        component.set("v.height", document.documentElement.clientHeight);
        helper.refreshData(component,event,helper);
    },
    refreshData : function(component,event,helper) {
        helper.refreshData(component,event,helper);
    }
})
/**
 * Created by Johan Karlsteen on 2017-10-08.
 */
({
        addData : function(chart, labels, data) {
            chart.data.labels = labels;
            chart.data.datasets[0] = data[0];
            chart.data.datasets[1] = data[1];
        },
        redrawData : function(component, event, helper, readings, chart, datasets) {
            helper.addData(chart, readings.ts, datasets);
            chart.update();
        },
        displayData : function(component, event, helper, readings) {
            var datasets = [readings.temperature, readings.humidity];
            var chart = window.myLine;
            if(chart != null) {
                helper.redrawData(component,event,helper,readings, chart, datasets);
            }
            var config = {
                type: 'line',
                data: {
                    labels: readings.ts,
                    datasets: [{
                                 label: 'Temperature',
                                 backgroundColor: 'red',
                                 borderColor: 'red',
                                 data: readings.temperature,
                                 yAxisID: "y-axis-1",
                                 fill: false,
                             },
                             {
                                 label: 'Humidity',
                                 backgroundColor: 'blue',
                                 borderColor: 'blue',
                                 data: readings.humidity,
                                 yAxisID: "y-axis-2",
                                 fill: false,
                             }]
                },
                options: {
                    maintainAspectRatio: true,
                    responsive: true,
                    title:{
                        display:false,
                        text:'Temperature'
                    },
                    tooltips: {
                        mode: 'index',
                        intersect: false,
                    },
                    hover: {
                        mode: 'nearest',
                        intersect: true
                    },
                    scales: {
                        yAxes: [{
                            type: "linear", // only linear but allow scale type registration. This allows extensions to exist solely for log scale for instance
                            display: true,
                            position: "left",
                            id: "y-axis-1",
                        }, {
                            type: "linear", // only linear but allow scale type registration. This allows extensions to exist solely for log scale for instance
                            display: true,
                            position: "right",
                            id: "y-axis-2",

                            // grid line settings
                            gridLines: {
                                drawOnChartArea: false, // only want the grid lines for one axis to show up
                            },
                        }],
                    }
                }
            };
            var ctx = document.getElementById("temperature").getContext("2d");
            window.myLine = new Chart(ctx, config);
        },
    refreshData : function(component,event,helper) {
        var spinner = component.find('spinner');
        $A.util.removeClass(spinner, "slds-hide");
        var action = component.get("c.getFridgeReadings");
        var endDate = component.get("v.today");
        var results = component.get("v.results");
        action.setParams({
        	deviceId : "2352fc042b6dc0ee",
        	results : results,
        	endDate : endDate
    	});
        action.setCallback(this, function(response){
            var state = response.getState();
            if (state === "SUCCESS") {
                var fridgereadings = JSON.parse(response.getReturnValue());
                helper.displayData(component,event,helper,fridgereadings);
            }
            var spinner = component.find('spinner');
            $A.util.addClass(spinner, "slds-hide");
        });
        $A.enqueueAction(action);
    }
})
And the Apex Class that fetches the data:
/**
 * Created by Johan Karlsteen on 2017-10-08.
 */

public with sharing class FridgeReadingHistoryController {

    public class FridgeReading {
        public String deviceId {get;set;}
        public List<string> ts {get;set;}
        public List<string> doorTs {get;set;}
        public List<integer> door {get;set;}
        public List<double> temperature {get;set;}
        public List<double> humidity {get;set;}
        public FridgeReading(String deviceId) {
            this.deviceId = deviceId;
            this.ts = new List<string>();
            this.doorTs = new List<string>();
            this.door = new List<integer>();
            this.temperature = new List<double>();
            this.humidity = new List<double>();
        }
        public void addReading(Fridge_Reading_History__b  fr) {
            addReading(fr.Temperature__c, fr.Humidity__c, fr.ts__c, fr.Door__c);
        }
        public void addReading(Decimal t, Decimal h, DateTime timeStamp, String d) {
            String tsString = timeStamp.format('HH:mm dd/MM');
            this.ts.add(tsString);
            temperature.add(t);
            humidity.add(h);
            Integer doorStatus = d == 'open' ? 1 : 0;
            if(door.size() == 0 || doorStatus != door.get(door.size()-1)) {
                door.add(doorStatus);
                doorTs.add(tsString);
            }
        }
    }

    @AuraEnabled
    public static String getFridgeReadings(String deviceId, Integer results, DateTime endDate) {
        if(results == null) {
            results = 200;
        }
        FridgeReading fr = new FridgeReading(deviceId);
        system.debug('RESULTS: ' +results);
        List<fridge_reading_history__b> frhs = [
                SELECT DeviceId__c, Temperature__c, Humidity__c, Door__c, ts__c
                FROM Fridge_Reading_History__b
                WHERE DeviceId__c = :deviceId AND ts__c <: endDate
                LIMIT :Integer.valueof(results)
        ];
        for (Integer i = frhs.size() - 1; i >= 0; i--) {
            Fridge_Reading_History__b frh = frhs[i];
            fr.addReading(frh);
        }
        return JSON.serialize(fr);
    }
}
The component assumes you have Charts.js as a static resource, mine is here.
There are no test cases anywhere and the code is probably not production grade.
The next step would be to use aggregate functions on the Big Objects to show data over a longer period of time.
Cheers, Johan

