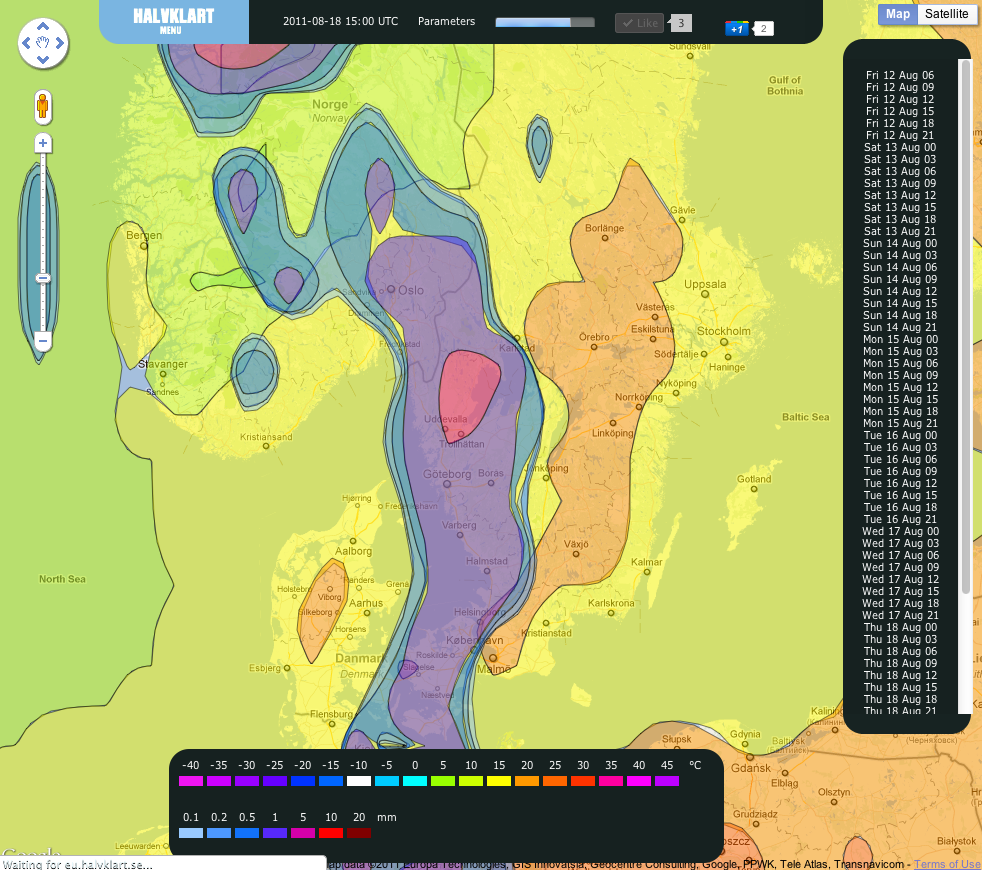
The last couple of weeks I have been experimenting with Google Maps trying to draw filled polygons that look alright. I’m using matplotlib for making the polygons and I’ve figured out that the output from contourf(…) is like a plotting routine where you first get a polygon that should be filled with the current level and the following ones are holes in it.
Before I just draw them all, coloring the holes with a lower color. This forced me to sort the polygons according to size which worked ok but didn’t look good.
In Google Maps v2 there was something called encoded polygons but it seems as if they were removed in v3 (never supported by Chrome anyway).
Anyway, the correct way in v3 is to do like this:
var paths = [[
new google.maps.LatLng(38.872886, -77.054720),
new google.maps.LatLng(38.872602, -77.058046),
new google.maps.LatLng(38.870080, -77.058604),
new google.maps.LatLng(38.868894, -77.055664),
new google.maps.LatLng(38.870598, -77.053346)
], [
new google.maps.LatLng(38.871684, -77.056780),
new google.maps.LatLng(38.871867, -77.055449),
new google.maps.LatLng(38.870915, -77.054891),
new google.maps.LatLng(38.870113, -77.055836),
new google.maps.LatLng(38.870581, -77.057037)
]];
  function initialize() {
    var map = new google.maps.Map(document.getElementById("map"), {
      zoom: 16,
      center: new google.maps.LatLng(38.8714, -77.0556),
      mapTypeId: google.maps.MapTypeId.SATELLITE
    });

    var poly = new google.maps.Polygon({
      paths: paths,
      strokeWeight: 3,
      fillColor: '#55FF55',
      fillOpacity: 0.5
    });

    poly.setMap(map);
  }
My project is now online at http://halvklart.se/ and here’s a screenshot:

There are some troubles with the polygons when applying the b-splines but I will try to take care of them in the near future.
I have briefly investigated Thrift and ProtoBuf but I’m still not sure that I will gain that much by switching from JSON. Also found something called BSON which is binary JSON. I think the next step will be to add some more parameters, wind direction is probably the hardest since I will have to draw the arrows myself.
